
Four metrics decide whether an outreach campaign is working: connection acceptance rate, reply rate of accepted connections, meetings booked, and pipeline attribution back to the sequence that sourced them. Everything else is context. Accurate answers require matured-funnel measurement (30+ days) and a CRM sync, since LinkedIn’s own reporting stops at content engagement. The Lead Lab tracks exactly these four numbers for every professional services client it runs campaigns for.
TL;DR:
- Acceptance rate should be around 27 percent in mature campaigns, with declines expected at high sending volumes due to LinkedIn’s volume tax.
- Reply rates of accepted connections typically range in the moderate percentage, but industry and account quality heavily influence these figures.
- Tracking individual sequence steps and response timing is crucial to identifying which messages drive engagement and avoid relying solely on blended metrics.
- CRM data validation and API version monitoring are essential to ensure accurate attribution and reporting, with mature data over 30 days providing stability.
- Investing in automated, API-driven reporting pipelines and comprehensive CRM integration delivers the most meaningful improvements in outreach measurement.
Table of Contents
- Why LinkedIn Native Analytics Fall Short for Outreach Measurement
- Core Outreach Metrics: Precise Definitions and Calculation Rules
- How to Collect and Validate Outreach Data Accurately
- What Are Realistic Benchmarks for Acceptance and Reply Rates?
- Optimization Actions: What Actually Moves the Needle
- The Lead Lab’s Approach to Campaign Analytics and Reporting
- Where Outreach Analytics Investment Should Go Next
- Get Managed Outreach With Built-In Campaign Analytics
- Sources
Why LinkedIn Native Analytics Fall Short for Outreach Measurement
LinkedIn’s built-in dashboard was built for content creators, not outreach teams. It reports impressions, reactions, comments, and profile views generated by posts, plus newer fields like post_save and link_clicks that Microsoft’s post statistics documentation defines in detail. None of that tells you whether step two of your sequence is converting better than step three.
The gap shows up in three places:
- Sequence performance by step is invisible. There’s no native view of acceptance or reply rate broken out per message in a multi-touch campaign.
- API access has real limits. LinkedIn’s ad analytics endpoints apply retention windows, reporting latency, and approximate demographic pivots with 12 to 24 hour delays, so pulling clean data requires patience and the right permissions.
- Engagement rate gets mistaken for outreach success. It’s a content efficiency measure, and research on engagement-rate benchmarks shows it swings wildly by post format and follower count, which makes it a poor stand-in for pipeline health.
That third point matters more than it looks. A campaign can generate strong post engagement while its connection requests sit ignored. Measuring on a matured 30-day window, rather than checking results after a week, is what separates a real read on performance from noise that happens to look encouraging.
Core Outreach Metrics: Precise Definitions and Calculation Rules
Ambiguous metric definitions are the fastest way to get a team arguing about numbers instead of fixing campaigns. Lock these down before anyone builds a dashboard.
Acceptance rate is connections accepted divided by connection requests sent. Reply rate of accepted is replies divided by accepted connections, the number that tells you if your messaging actually lands once someone says yes. Reply rate of all sends divides replies by total requests sent, useful for spotting targeting problems early. Meeting conversion is booked meetings divided by replies. Pipeline-sourced revenue rate ties closed-won deals back to the sequence that originated the contact, which requires the CRM connection covered in the next section.
| Metric | Formula | What it tells you |
|---|---|---|
| Acceptance rate | Accepted ÷ Requests sent | Targeting and profile quality |
| Reply rate (accepted) | Replies ÷ Accepted connections | Message quality post-connect |
| Reply rate (all sends) | Replies ÷ Requests sent | Overall funnel health |
| Meeting conversion | Meetings booked ÷ Replies | Response-to-meeting effectiveness |
| Pipeline-sourced rate | Attributed revenue ÷ Total pipeline | Campaign revenue contribution |
Sequence-level tracking adds another layer: acceptance and reply broken out by individual step, time-to-reply, and side-by-side A/B comparisons of message variants. A campaign that reports one blended reply rate is hiding whether message three is carrying the whole sequence or dragging it down.
Secondary metrics like profile views from content or link clicks are worth watching, but only as supporting context for brand visibility, never as a proxy for pipeline.
Pro Tip: Build your acceptance and reply formulas into a spreadsheet template before your first campaign launches, not after. Retrofitting metric definitions onto three months of inconsistent data wastes more time than setting the rules up front.
How to Collect and Validate Outreach Data Accurately
Getting clean outreach data means knowing which LinkedIn endpoint reports which metric, respecting permission scopes, and building a validation habit before you trust any number in a report.
- Pull post and profile-level data through the correct API. LinkedIn’s memberCreatorPostAnalytics endpoint requires the r_member_postAnalytics permission and returns impression, reach, and engagement fields at the post level, per the developer documentation.
- Wait for the funnel to mature. A 30-day maturity window, backed by LinkedInsider’s 2026 outreach data, produces stable acceptance and reply figures. Anything measured earlier tends to overstate volatility in either direction.
- Deduplicate and tag events before they hit your CRM. Every accepted connection, reply, and booked meeting needs a campaign tag so it can be traced back to its originating sequence.
- Push tagged events into your CRM sync. Revenue attribution fields such as revenueWonInUsd only populate once the ads-reporting schema’s CRM connection is live, and even then expect processing delays before figures settle. A structured CRM integration workflow makes this step far less error prone.
- Track API version changes. LinkedIn issues deprecation notices on a regular schedule, and a sunset endpoint can quietly break your reporting pipeline if nobody’s watching for migration windows.
Two pitfalls trip up most teams: treating demographic pivots as exact when they’re approximate estimates with built-in delay, and mixing daily and weekly granularities in the same report, which makes trend lines meaningless. Third-party dashboards can also report numbers that differ slightly from LinkedIn’s own counts, something Hootsuite’s metrics documentation flags directly, so validate against the source API before you present a figure to leadership.
What Are Realistic Benchmarks for Acceptance and Reply Rates?
Large-sample data gives you a real baseline instead of a guess. LinkedInsider’s 2026 annual report puts matured acceptance rates around the high twenties percentage range, with reply-of-accepted historically landing in a moderate range, though that figure has been softening industry-wide through 2026.
A few factors shift those numbers meaningfully for any given campaign:
- Sending volume matters more than most teams assume. Pushing too many requests from one account triggers what LinkedInsider calls a “volume tax,” where acceptance drops as daily send counts climb past a safe threshold.
- Seniority and industry both move the baseline. Executive-level targets convert differently than mid-level managers, and professional services benchmarks rarely match tech-sector numbers.
- Account content authority helps. A profile with regular posting activity and a complete history tends to out-convert a bare-bones profile sending the same message.
Pro Tip: Don’t benchmark a brand-new sending account against industry averages in its first two weeks. New accounts need a warm-up period, and comparing week-one numbers to a matured 27% acceptance rate will make a perfectly healthy campaign look broken.
Optimization Actions: What Actually Moves the Needle
Most campaigns plateau not because the offer is wrong, but because nobody is testing the right variable. Here’s where to put your effort, in rough order of impact.
- Test personalization at the message level, not just the opener. Referencing a specific post or a recent role change in step two consistently outperforms generic templates, and it’s the easiest variable to A/B test cleanly.
- Default to a three-message sequence before building anything longer. Expandi’s analysis of over 13 million connection requests found three-message campaigns often beat longer ones on reply rate, which means the effort belongs in sharpening those three touches rather than adding a fourth or fifth.
- Cap sends per account and scale horizontally, not vertically. Adding a second verified account with its own safe volume outperforms pushing one account past its comfortable daily cap, and it protects account stability over time.
- Run message-length tests deliberately. Expandi’s dataset shows reply rates shift across different length bands, so treat message length as its own testable variable rather than an afterthought.
- Watch AI-generated copy against human-edited templates. The same Expandi data found AI-hyperpersonalized messages didn’t consistently outperform human-written ones, so don’t assume automation alone fixes a weak sequence.
A detailed breakdown of outreach tactics is worth reviewing before you build your next test calendar, since sequencing decisions compound across every campaign that follows.
The Lead Lab’s Approach to Campaign Analytics and Reporting
The Lead Lab runs its own campaigns against the same four core metrics covered above: acceptance rate, reply rate of accepted, meetings booked, and pipeline attribution, reported on matured 30-day windows rather than early, noisy snapshots. Every client campaign gets precision-targeted prospecting built around seniority and industry fit, since targeting quality drives acceptance more than any message tweak ever will.

Reporting cadence matters as much as the metrics themselves. Clients see sequence-level breakdowns, not blended averages, because analytics discipline is what separates outreach that scales from outreach that stalls out at month two.
Toby, who oversees campaign strategy at The Lead Lab, notes that the agency’s clients who ask for their reporting templates upfront tend to make faster, better-informed decisions about which sequences to kill and which to scale.
Where Outreach Analytics Investment Should Go Next
The next real gains in outreach measurement won’t come from a flashier dashboard. They’ll come from API-first reporting pipelines that pull data directly rather than relying on manual exports, and from teams finally standardizing their outreach motion so results are comparable campaign over campaign.
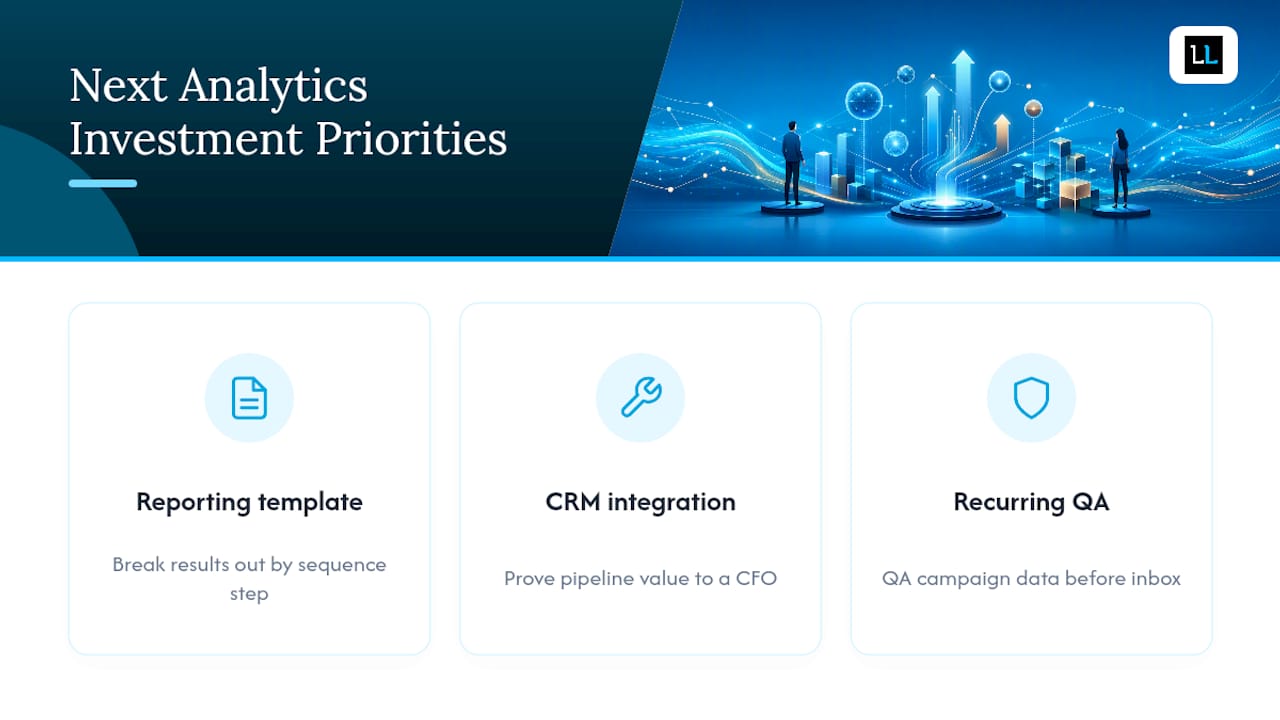
CRM attribution is the piece most teams underinvest in, even though it’s the only way to prove pipeline value to a CFO. Account stability deserves equal attention: as personalization strategies mature and per-account caps get respected, campaigns hold up longer without triggering the volume tax that quietly erodes acceptance.
If you’re deciding where to spend the next quarter’s analytics budget, put it toward three things: a reporting template that breaks results out by sequence step, a CRM integration workstream, and a recurring QA check on campaign data before it reaches a stakeholder’s inbox. Analytics investment tends to pay for itself faster than most teams expect once attribution is actually working.
— Toby
Get Managed Outreach With Built-In Campaign Analytics
The Lead Lab exists for teams who want the metrics covered in this article tracked and acted on without building the reporting infrastructure themselves. It handles prospect targeting, message copywriting, response management, and campaign analytics as one package, so acceptance rate, reply rate, and meeting conversion show up in your reporting from week one instead of after months of internal setup.
Onboarding starts with defining your target accounts and seniority bands, then moves into sequence copywriting and a launch timeline with committed KPIs attached, not vague projections. Reporting follows the matured-funnel approach covered above, so you’re comparing real 30-day numbers instead of noisy week-one snapshots. Professional services firms can see how those campaigns perform in practice through The Lead Lab’s client portfolio, and the fastest way to see if it fits your team is to book a consultation and walk through what a managed campaign would look like for your specific accounts.
Sources
For implementation detail beyond this guide: LinkedIn’s post statistics API and ads reporting schema cover metric definitions directly, while LinkedInsider’s benchmark report and The Lead Lab’s campaign analytics guide cover operational targets.
- Retrieve post statistics (LinkedIn Developer documentation)
- State of LinkedIn Outreach 2026: Annual Report | LinkedInsider
- State of LinkedIn Outreach H2 2026 | Expandi Data Report