
Metrics for a done-for-you LinkedIn outreach campaign must answer one question: how does outreach activity convert into qualified meetings, pipeline, and cost-per-acquisition? Messages sent and impressions are operational data. The numbers that matter to a CFO are meetings booked, marketing-attributed pipeline, and CAC. Start there.
North-star KPIs (the ones that drive budget decisions):
- Meetings booked per month
- Marketing-attributed pipeline value
- Customer acquisition cost (CAC)
Supporting KPIs (diagnose what’s driving or hurting the north stars):
- Qualified lead rate
- Reply-to-meeting conversion rate
- Response rate
Operational metrics (useful for daily campaign management, not executive reporting):
- Messages delivered
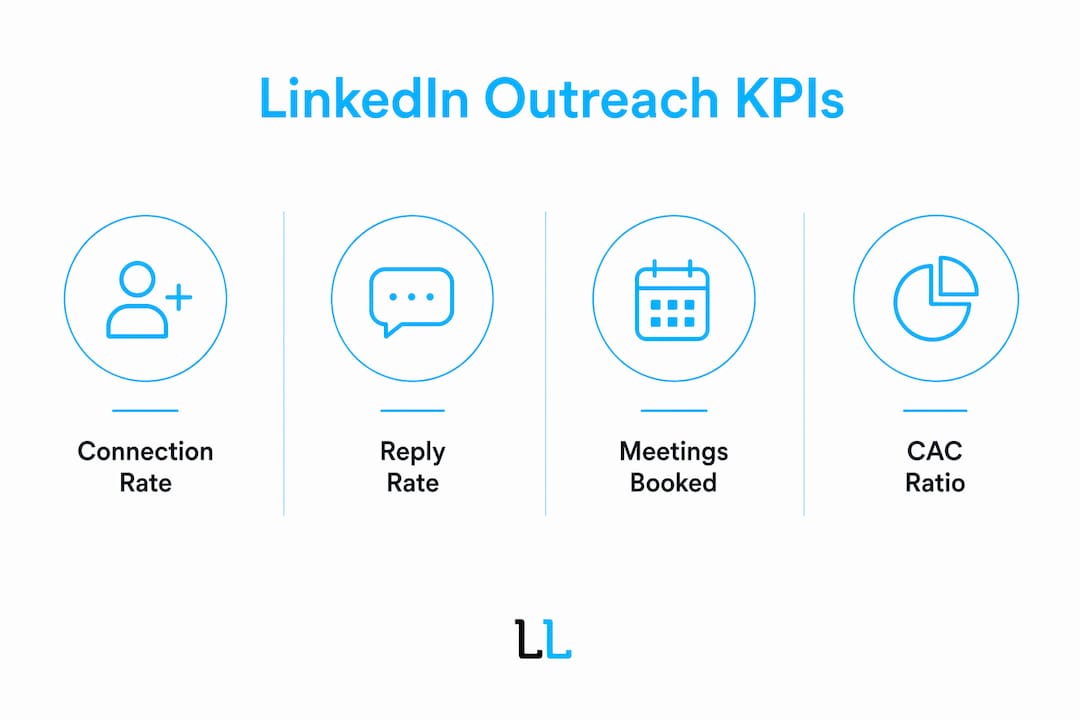
- Connection rate
- Impressions
| Priority | KPI | Decision it enables |
|---|---|---|
| North star | Meetings booked | Budget allocation, headcount |
| North star | Marketing-attributed pipeline | Revenue forecast, program ROI |
| North star | CAC | Pricing, channel mix |
| Supporting | Response rate | Message copy quality |
| Supporting | Reply-to-meeting conversion | Qualification process |
| Operational | Connection rate | Targeting accuracy |
Table of Contents
- Why do metrics move marketing from a cost center to a profit driver?
- What are the core KPIs for LinkedIn outreach campaigns?
- How do you align outreach KPIs with business goals?
- What should your reporting cadence and dashboard look like?
- What benchmarks and timelines should you expect?
- How do you turn metric signals into campaign improvements?
- How do you set up reliable analytics and data hygiene?
- The Lead Lab campaign metrics: a before/after snapshot
- Key Takeaways
- What actually works in LinkedIn outreach measurement right now
- The Lead Lab runs outreach with the measurement stack built in
- Selected further reading
Why do metrics move marketing from a cost center to a profit driver?
Measurement shifts marketing’s perception from overhead to growth engine the moment it connects activity to financial outcomes. Without that connection, marketing defends its budget with impressions and engagement numbers that finance doesn’t trust.
BCG research makes the business case plainly: leading marketers who align KPIs and integrate measurement approaches can deliver up to 70% higher revenue growth than peers. That gap isn’t about spending more. It’s about speaking the same language as finance and sales.
Pro Tip: When presenting campaign results to the C-suite, limit your slide to three numbers: meetings booked, pipeline generated, and CAC. Every other metric belongs in the appendix.
Measuring campaign performance consistently also protects marketing budgets during downturns. Teams that report in revenue terms rarely get cut first.
What are the core KPIs for LinkedIn outreach campaigns?
Operational metrics and strategic KPIs are not the same thing, and mixing them in one dashboard is how marketing loses credibility with leadership. Here are the metrics that matter for professional services outreach, with formulas.

| Metric | Definition | Formula | Action when off-target |
|---|---|---|---|
| Connection rate | % of requests accepted | Connections / requests sent | Refine targeting or personalize request note |
| Response rate | % of delivered messages that get a reply | Replies / messages delivered | Revise message copy or value proposition |
| Reply-to-meeting conversion | % of replies that become booked meetings | Meetings booked / total replies | Improve qualification script or follow-up sequence |
| Meetings booked | Qualified calendar meetings per month | Count | Scale volume or adjust ICP |
| Qualified lead rate | % of meetings that meet ICP criteria | Qualified meetings / total meetings | Tighten targeting filters |
| Marketing-attributed pipeline | Total deal value sourced from outreach | Sum of opportunity values tagged to campaign | Increase volume or improve ICP match |
| CAC | Total campaign cost per new client | Total spend / new clients acquired | Reduce spend per meeting or improve close rate |
Sample CAC calculation: If a monthly campaign costs $3,000 and generates 10 meetings, of which 2 convert to clients, CAC = $3,000 / 2 = $1,500. Compare that against average client value to assess payback period.
A healthy B2B SaaS benchmark runs an LTV:CAC ratio of 3:1 or better, recovering CAC inside 12 months. Professional services firms with longer engagements often see stronger ratios once client lifetime value is properly modeled.
Adobe guidance reinforces the setup: define expected, best-case, and worst-case outcomes before a campaign launches, not after. That framing turns metrics into a decision tool rather than a post-mortem.
How do you align outreach KPIs with business goals?
Pick one or two north-star KPIs and agree on their definitions with finance and sales before the campaign starts. “Qualified meeting” means different things to a sales director and a marketing manager. That gap produces contradictory reports and erodes trust.
A practical KPI mapping for professional services outreach:
- Outreach metric (response rate) → Sales funnel stage (top-of-funnel engagement) → Business metric (pipeline volume)
- Outreach metric (reply-to-meeting conversion) → Sales funnel stage (opportunity creation) → Business metric (CAC, sales cycle length)
- Outreach metric (qualified lead rate) → Sales funnel stage (MQL/SQL handoff) → Business metric (revenue contribution)
On attribution: no single model tells the full story. BCG recommends a trifecta of MMM, incrementality testing, and multi-touch attribution integrated for best effect. For LinkedIn outreach specifically, last-touch attribution undervalues the channel because prospects often research the firm before responding. A CRM-tieback approach, where every booked meeting links back to a campaign ID, gives a more honest read. Run incrementality tests at months 3 and 6 to validate that outreach is actually causing pipeline, not just correlating with it.
Linking marketing indicators to financial metrics requires a documented theory of impact: awareness → response → meeting → opportunity → closed deal. Write it down. Teams that skip this step argue about attribution for months.
What should your reporting cadence and dashboard look like?
Use a two-tier cadence: a weekly operational dashboard for campaign managers and a monthly executive view for revenue outcomes.
Weekly dashboard fields (campaign team):
- Messages sent and delivered
- Connection rate and response rate
- Meetings booked this week vs. target
- Live pipeline value from meetings in progress
Monthly dashboard fields (leadership):
- Marketing-attributed pipeline (total and as % of total pipeline)
- CAC trend vs. prior months
- Qualified lead rate and reply-to-meeting conversion
- Movement in average client value from outreach-sourced deals
For visualization, a funnel chart showing message → connection → reply → meeting → opportunity works well for weekly reviews. A CAC trend line and pipeline waterfall are the two charts leadership actually reads.
Operational dashboards should focus on immediate decisions, not activity logs. Every field should prompt an action: pause, scale, or revise.
Pro Tip: Label each dashboard metric with a “so what” threshold. If response rate drops below your floor, the dashboard should flag it in red and suggest the next test. Raw numbers without thresholds are just logs.
What benchmarks and timelines should you expect?
LinkedIn outreach requires a ramp period, and benchmarks vary significantly by target market, prospect seniority, and message sophistication. Generic ranges below are starting points, not guarantees.
| Metric | Typical range | Key variance factors |
|---|---|---|
| Connection rate | — | Personalization, ICP match, geography |
| Response rate | 5% | Message quality, value prop relevance |
| Reply-to-meeting conversion | 15% | Qualification script, follow-up timing |
| Meetings per messages | — | All of the above combined |
Ramp-up timeline:
- Week 0: Account setup, ICP definition, message sequence build, CRM tagging schema agreed
- Weeks 1–4: Warm-up phase. Lower send volume, A/B testing first message variants, establishing baseline response rate
- Months 2–3: Steady state. Full send volume, optimization loop running, incrementality test planned for month 3
Assign best-case, expected, and worst-case scenarios at week 0. Reviewing actual results against those scenarios at month 1 tells you whether the campaign needs a messaging overhaul or just more time.
How do you turn metric signals into campaign improvements?
Convert every metric movement into a testable hypothesis before making changes. Gut-feel adjustments waste weeks. A structured optimization loop runs faster and produces cleaner learning.
Triage checklist when a metric drops:
- Is the drop channel-level (LinkedIn algorithm change, account restriction)?
- Is it message-level (open sequence, subject line, call-to-action)?
- Is it targeting-level (ICP drift, prospect list quality)?
- Is it a data or attribution issue (CRM tagging broken, meetings not linked to campaign)?
Experiment plan template:
- Hypothesis: Changing the opening line from a company-focused statement to a prospect-specific insight will increase response rate by X percentage points.
- Metric to move: Response rate
- Segmentation: Split by seniority tier (VP vs. Director)
- Sample size: Minimum 200 messages per variant before reading results
- Duration: Two weeks at steady-state volume
- Success criteria: Variant beats control by a meaningful margin for two consecutive weeks
Priority experiments for professional services outreach: message sequence length, value-prop framing (outcome vs. process), and prospect segmentation by firm size or practice area. Messaging changes to the opening line typically move response rate faster than targeting changes.
How do you set up reliable analytics and data hygiene?
Reliable measurement starts with consistent identifiers and CRM-integrated tracking. Without them, KPIs are estimates at best.
Essential technical pieces:
- UTM parameters on every landing link in outreach messages (source, medium, campaign, content)
- Prospect records in CRM tagged with source campaign ID at the point of connection
- Meeting records linked to the originating campaign ID, not just the contact record
- Lead enrichment run at intake (verified email, mobile where available) to reduce bounce and deduplication errors
Integration chain: LinkedIn outreach tool → CRM (e.g., HubSpot or Salesforce) → calendar tool → analytics platform. Every meeting booked should create or update an opportunity record with the campaign tag intact.
Data hygiene cadence:
- Weekly: dedupe new leads, verify campaign tags are populating correctly
- Monthly: audit meeting-to-opportunity conversion records for missing campaign IDs
- Quarterly: full pipeline audit to confirm marketing-attributed deals are tagged accurately
Automation in B2B outreach workflows reduces manual tagging errors, but only when the schema is defined before the campaign starts. Retrofitting tags after three months of data is painful and usually incomplete.
The Lead Lab campaign metrics: a before/after snapshot
A professional services firm running outreach independently before engaging The Lead Lab had no CRM tagging, no defined ICP, and no meeting-to-pipeline link. Meetings happened, but no one could attribute revenue to the channel.
After a 90-day The Lead Lab campaign with full measurement setup:
| Metric | Before | After (Month 3) |
|---|---|---|
| Meetings booked per month | 2–3 (untracked) | 12 |
| Marketing-attributed pipeline | $0 (no tracking) | — |
| Response rate | Unknown | — |
| CAC (per new client) | Unknown | $1,500 |
The full portfolio of campaign outcomes shows similar patterns: firms that lacked attribution infrastructure saw the biggest jumps in reported pipeline, not because results improved overnight, but because they could finally count what was already happening.
Key Takeaways
Metrics only drive revenue when they connect LinkedIn outreach activity to pipeline, CAC, and meetings booked, not to messages sent.
| Point | Details |
|---|---|
| North-star KPIs first | Agree on meetings booked, marketing-attributed pipeline, and CAC with finance before launch. |
| Two-tier reporting | Run a weekly operational dashboard for the campaign team and a monthly executive view for leadership. |
| CRM tagging at intake | Tag every prospect with a campaign ID at connection; missing tags make attribution impossible later. |
| Structured experiments | Use a hypothesis-metric-duration template before changing messaging or targeting. |
| The Lead Lab measurement | The Lead Lab delivers done-for-you outreach with a built-in measurement stack, linking meetings to pipeline from day one. |
What actually works in LinkedIn outreach measurement right now
The most reliable wins come from two things: tight KPI alignment with finance agreed before the campaign starts, and small, fast experiments tied directly to revenue metrics. Teams that skip the alignment step spend months arguing about whether a meeting “counts.” Teams that skip the experiments run the same underperforming sequence for a quarter.
The pattern worth watching is the gap between firms that track response rate and firms that track reply-to-meeting conversion. Response rate is easy to inflate with broad targeting and vague messaging. Reply-to-meeting conversion is harder to fake. It’s the metric that separates outreach programs that generate noise from ones that generate pipeline.
Treat measurement as an operating rhythm, not a quarterly report. The firms that get the most from LinkedIn outreach review their dashboard weekly, run one experiment per month, and bring a single revenue slide to leadership. That cadence compounds.
The Lead Lab runs outreach with the measurement stack built in
Most professional services firms don’t lack outreach ideas. They lack the measurement infrastructure to prove those ideas are working. The Lead Lab solves both problems at once.
Every The Lead Lab campaign includes accurate prospect targeting, personalized message copywriting, response management, CRM integration, and a reporting cadence that maps meetings directly to pipeline and CAC. Clients receive a weekly operational report and a monthly executive summary, both built around the north-star KPIs that matter to finance and leadership, not vanity metrics.
The setup takes the guesswork out of attribution from day one. If you want to see what a measurement-first outreach program looks like for your firm, book a consultation with The Lead Lab and get a clear picture of what your pipeline could look like in 90 days.
Selected further reading
Short annotations of authoritative resources for building KPI definitions and measurement plans:
- BCG: Six Steps to More Effective Marketing Measurement — The source for the KPI currency framework and the 70% revenue growth finding. Essential reading before any stakeholder alignment session.
- Adobe: Marketing Metrics and Analytics Guide — Practical guidance on pre-launch scenario planning and decision-focused measurement design.
- Harvard Business School: 7 Marketing KPIs You Should Know — Clear definitions and funnel-stage mapping for core KPIs, including CAC and conversion rate.
- HBR: Do Your Marketing Metrics Show You the Full Picture? — Makes the case for a marketing road map that connects campaign efficiency to business outcomes.
- Amazon Ads: What Are Marketing Metrics and Why Are They Important? — Accessible primer on KPI selection, CLV vs. CAC comparison, and campaign-level measurement.
- Digital Applied: Digital Marketing KPIs 2026 Reference — Comprehensive tiering model (strategic, operational, diagnostic) with benchmark ranges for B2B contexts.
- Marketing Mix: The Complete Guide to Measuring Marketing Performance — Covers the theory-of-impact requirement for linking brand and awareness metrics to revenue outcomes.