
Analytics turns LinkedIn outreach from a volume game into a measurable revenue engine. Without it, you’re sending messages and hoping. With it, you know exactly which targeting segments reply, which message variants book meetings, and what each qualified conversation is worth to your pipeline. That’s the shift that separates firms charging commodity rates from those commanding premium fees.
Here’s what that looks like in practice:
- Firms that instrument their outreach can attribute pipeline directly to campaigns, giving them the evidence to justify fees and raise them.
- Clients now demand evidence-backed recommendations, making analytics a central pillar of every engagement, not a back-office function, as explained in How AI Is Transforming SWOT Analysis by MOGHQ.
- Consulting-specific analytics that track utilization and project margins can unlock significant profitability gains versus generic BI tools.
- Winning outreach models become reusable playbooks, turning a single campaign into durable firm IP.
The Lead Lab builds every client campaign around this measurement-first logic: tag, track, integrate, and report before the first message goes out.
Table of Contents
- Why analytics matter for consultants: the KPIs worth tracking
- How analytics changes your value proposition and pricing
- How to set up LinkedIn outreach data capture step by step
- How to read your results and act on them
- Common pitfalls and LinkedIn compliance considerations
- How long until you see results, and how to calculate ROI
- Real outcomes from analytics-driven outreach
- Key Takeaways
- The case for treating analytics as a deliverable, not a report
- What The Lead Lab delivers for consultants who want measurable outreach
- Useful sources and further reading
Why analytics matter for consultants: the KPIs worth tracking
Not every metric deserves your attention. The ones that do fall into two tiers: campaign health and firm economics.
Campaign-level KPIs
| KPI | What it measures | Formula | Signal horizon |
|---|---|---|---|
| Connection rate | Targeting quality | Accepted / sent | 1–2 weeks |
| Reply rate | Message relevance | Replies / delivered | 2–3 weeks |
| Positive reply rate | Intent quality | Positive replies / total replies | 2–3 weeks |
| Meeting rate | Full-funnel conversion | Meetings / 100 messages | 4–6 weeks |
| Qualified lead rate | Lead quality | Qualified meetings / total meetings | 4 weeks |
| Cost per meeting | Efficiency | Campaign cost / meetings booked | 4 weeks |
Firm-level KPIs to connect outreach to consulting economics
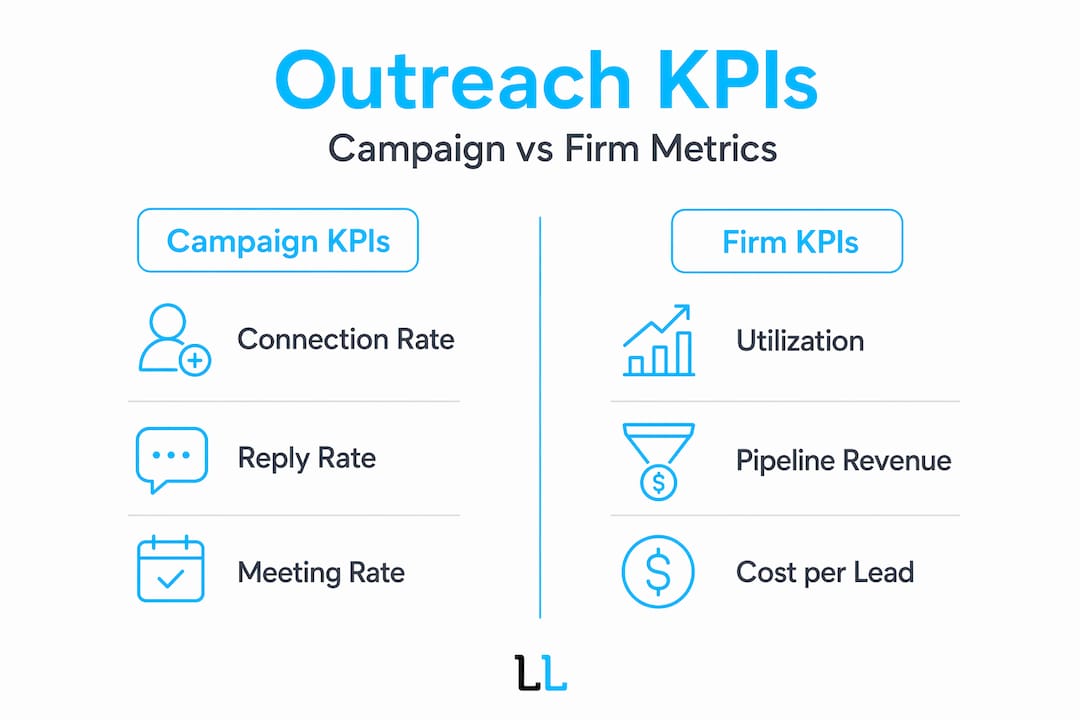
High-performing consulting firms achieve utilization benchmarks of 75–80% versus an industry average of ~67%. Tracking how new pipeline from LinkedIn outreach fills bench capacity tie your marketing spend directly to margin. Add proposal conversion rate, time-to-meeting, and lifetime client value to complete the picture.
For sales funnel metrics, watch pipeline-influenced revenue (total deal value where outreach touched at least one contact), proposal conversion rate, and average days from first reply to signed contract.
Pro Tip: Start with five to seven KPIs maximum. Connection rate, reply rate, meeting rate, qualified lead rate, and cost per meeting give you enough signal to optimize without drowning in dashboards. Add firm-level metrics once the campaign layer is stable.
LinkedIn Sales Navigator feeds targeting and engagement signals. LinkedIn Campaign Manager tracks paid impressions and click-through rates. HubSpot CRM or Salesforce logs every outreach record, meeting, and opportunity stage. Zapier automates the handoff between LinkedIn activity and CRM records. Looker Studio pulls it all into a single reporting view. That’s the campaign analytics stack that actually works.
How analytics changes your value proposition and pricing
The positioning shift analytics enables is concrete. As Brian C Jensen puts it:
That shift matters because “trusted advisor” is a relationship claim. “Strategic operator” is a performance claim. Clients pay more for the second one because they can see the return.

Consulting-specific BI implementations deliver 15–25% improvements in operational profitability for firms that track utilization and project margins. When you can show a client that your outreach-sourced pipeline filled three previously benched consultants for six weeks, that’s a number they can put in a board deck. Evidence-based proposals, scenario modeling, and ROI-backed recommendations don’t just increase trust. They reduce the client’s perceived risk, which is the real lever on retention and renewal rates.
How to set up LinkedIn outreach data capture step by step
Most consultants spend 50–70% of their time chasing data rather than analyzing it. A clean instrumentation setup eliminates that waste before the campaign launches.
- Define UTM conventions. Every LinkedIn outreach campaign gets a consistent UTM structure: source (linkedin), medium (outreach), campaign name, and content variant. No exceptions.
- Create campaign records in your CRM. In HubSpot or Salesforce, build a campaign object for each outreach sequence before messages go out. Every contact touched gets associated with that record.
- Map outcome stages. Define what “replied,” “meeting booked,” “qualified,” and “proposal sent” mean in your CRM pipeline, and make sure every rep logs to the same stage definitions.
- Automate the handoff with Zapier. Connect LinkedIn Sales Navigator activity (accepted connections, replies) to CRM contact updates. This removes manual logging and keeps data clean.
- Log meetings as revenue-influencing events. Every booked meeting gets tagged to its originating campaign. This is what lets you calculate cost per meeting and pipeline-influenced revenue later.
- Pull it into Looker Studio. Build four dashboard panels: campaign health (connection rate, reply rate), reply funnel (positive reply rate, meeting rate), pipeline influenced (opportunities and value), and utilization impact (bench days filled by new pipeline).
Building dashboards with clients alongside this process turns reporting into a trust exercise. Clients who see their pipeline data in real time become active partners in refining targeting, not passive recipients of a monthly PDF.
Pro Tip: Run a UTM audit and a CRM mapping test on a 10-message sample before the full campaign launches. Catching a broken Zapier flow or a missing campaign tag at that stage costs minutes, not weeks of bad data.
How to read your results and act on them
Before you trust any trend, check your sample size. Reply rate signals stabilize around 100–150 delivered messages. Meeting rate needs 50–75 meetings to be reliable. Revenue impact takes 3–6 months of pipeline data. Acting on 20 messages is how firms make expensive decisions on noise.
Common scenarios and what to do:
- Low reply rate: Test one variable at a time: message opening, persona targeting, or send timing. Keep everything else constant.
- High reply, low meeting rate: The message is working but the qualification step is failing. Tighten your call-to-action or add a pre-meeting qualifier question.
- Good meeting rate, low win rate: The problem is in discovery or pricing. Run a prospect segmentation review to check whether you’re attracting the right ICP.
For A/B tests, define your hypothesis, set a minimum sample size before you start, run variants simultaneously, and set a fixed measurement window (typically 3–4 weeks for reply rate tests). When a variant wins, document the targeting, message, and sequence structure. That’s your playbook.
Common pitfalls and LinkedIn compliance considerations
The measurement mistakes that produce misleading data are predictable:
- Inconsistent UTMs. One campaign tagged “LinkedIn” and another tagged “linkedin” are two separate sources in Looker Studio. Standardize casing in your UTM convention document.
- Attribution without verification. A meeting that came from a referral and a LinkedIn touch is not a LinkedIn-sourced meeting. Log the originating source accurately.
- Double-counting leads. The same contact appearing in two sequences inflates reply and meeting rates. Deduplicate CRM records before reporting.
- Trusting small samples. Fifty messages is not a campaign. It’s a test. Treat it that way.
On compliance: LinkedIn’s terms of service prohibit automated scraping and mass connection requests via third-party tools that violate platform rules. Stick to LinkedIn Sales Navigator’s native export and engagement features. For contact data handling, follow US data privacy best practices: store only what you need, log consent where required, and don’t share enriched contact data with third parties without a lawful basis. Automation that supports tracking is fine; automation that bypasses LinkedIn’s platform controls is not.
How long until you see results, and how to calculate ROI
| KPI | Reliable signal window | Recommended test duration |
|---|---|---|
| Reply rate | 2–3 weeks | 3–4 weeks |
| Meeting rate | 4–6 weeks | 6 weeks |
| Qualified lead rate | 4 weeks | 8 weeks |
| Revenue / pipeline impact | 3–6 months | 6 months minimum |
ROI formula: (Incremental revenue influenced by outreach − campaign cost) / campaign cost. For pipeline-influenced revenue, attribute the percentage of deal value proportional to outreach’s role in the sales cycle. A deal where LinkedIn outreach initiated the first contact and drove the meeting typically warrants 60–80% attribution.
Firms using advanced resource forecasting analytics see a 23% reduction in bench time and 18% fewer assignment conflicts. When your outreach pipeline fills those bench gaps, the ROI calculation extends beyond campaign cost to include recovered utilization revenue.
Real outcomes from analytics-driven outreach
Firms that connect outreach analytics to firm economics report faster deal cycles and higher utilization. The mechanism is straightforward: when you know which message variant books meetings with CFOs at mid-market professional services firms, you stop testing and start scaling that variant. The data-driven decision-making that enables this isn’t a capability reserved for large firms.
Semantics Technologies notes that clients now expect consultants to validate recommendations with empirical evidence, using statistical modeling and trend evaluation rather than qualitative judgment alone. Alfons Marques and the Technova Partners research reinforce this: firms that build consulting-specific analytics around utilization and project margins outperform peers by 15–25% on operational profitability. The pattern holds for outreach analytics too. Firms that instrument their LinkedIn campaigns and report pipeline-influenced revenue to clients position themselves as operators, not advisors, and that positioning holds up at renewal time.
A succinct way to show client ROI in proposals: “Our outreach campaign generated X qualified meetings over Y weeks, influenced $Z in pipeline, and filled N bench days at a blended rate of $R/day. Net ROI: [formula result].”
Key Takeaways
Analytics-driven LinkedIn outreach converts campaign activity into measurable pipeline, defensible fees, and reusable firm playbooks that compound in value over time.
| Point | Details |
|---|---|
| Instrument before you launch | Set UTMs, CRM campaign records, and Zapier automations before the first message goes out. |
| Track five to seven KPIs first | Reply rate, meeting rate, qualified lead rate, cost per meeting, and pipeline-influenced revenue cover most of what you need to optimize. |
| Wait for statistical confidence | Reply rate needs 100–150 messages; revenue impact needs 3–6 months of pipeline data before you act on a trend. |
| Tie outreach to firm economics | Connecting new pipeline to bench utilization turns a marketing metric into a P&L argument. |
| The Lead Lab approach | The Lead Lab delivers done-for-you outreach with built-in campaign analytics, CRM integration, and dashboard reporting so every campaign produces both meetings and measurable data. |
The case for treating analytics as a deliverable, not a report
The conventional wisdom says analytics is how you measure outreach. That’s too narrow. The firms getting the most from their LinkedIn campaigns treat analytics as a deliverable in its own right: a dashboard the client can see, a playbook the firm can resell, and a pricing argument the consultant can make at renewal.
Most articles on this topic stop at “track your KPIs.” The more interesting question is what happens when you productize the analytical model. A scoring rule that identifies which LinkedIn segments convert at 3x the average rate is not just a campaign insight. It’s IP. It belongs in your proposal as a methodology, in your client report as evidence, and in your next campaign as a starting point rather than a hypothesis.
The other thing most guides underestimate is the compliance layer. LinkedIn’s terms of service are specific about what automation is permitted, and US data privacy expectations around contact enrichment are tightening. Firms that build clean, consent-aware data flows now will have a structural advantage when those expectations harden into requirements.
The Lead Lab’s kickoff process runs a five-step campaign audit: UTM convention review, CRM mapping validation, sample messaging test on a small cohort, dashboard baseline in Looker Studio, and a 30-day A/B test with defined stop conditions. That sequence exists because the analytics infrastructure matters as much as the message copy.
Pro Tip: Package your outreach analytics as a client-facing deliverable: a one-page dashboard showing meetings influenced, pipeline value, and utilization impact. Clients who see that report renew. Clients who only see a meeting count ask whether they need you next quarter.
What The Lead Lab delivers for consultants who want measurable outreach
Consultants who’ve read this far know what good outreach analytics looks like. The harder part is building and running it while also delivering client work.
The Lead Lab handles the full stack: targeted prospect lists built from LinkedIn Sales Navigator, personalized message sequences written for your ICP, response management, and campaign analytics delivered in a dashboard you can show clients. Every campaign includes CRM integration setup, UTM tagging, and a reporting template that maps meetings to pipeline-influenced revenue. The result is a monthly report that answers the question clients actually ask: “What did this generate?”
Firms that want proof before committing can review client outcomes from previous campaigns. For a direct conversation about what a campaign audit and 30-day test would look like for your firm, book a demo with The Lead Lab.
Useful sources and further reading
| Source | Why it’s relevant |
|---|---|
| Semantics Technologies: The Power of Data Analytics in Modern Consulting | Covers client demand for evidence-based recommendations and the role of predictive analytics in consulting engagements. |
| Technova Partners: Business Intelligence for Consulting Firms | Source for the 15–25% profitability improvement benchmark, utilization data, and resource forecasting analytics findings. |
| Brian C Jensen: Data-Driven Consulting | Covers the positioning shift from trusted advisor to strategic operator and the role of analytics in fee justification. |
| Hacking the Case Interview: Data Analytics in Management Consulting | Practical guide on co-building dashboards with clients and productizing analytical models. |
| Wipro: How Analytics Helps Business Consultants | Data on consultant time spent chasing data (50–70%) and the efficiency case for instrumented data capture. |
| The Lead Lab: Campaign Analytics Guide | Internal guide on applying analytics specifically to LinkedIn lead generation campaigns. |
| The Lead Lab: Why Measure Campaign Performance | Covers what to measure, how to report it, and how to connect campaign data to client outcomes. |
| The Lead Lab: LinkedIn Outreach Tips | Tactical outreach guidance that pairs with the measurement and A/B testing framework in this article. |
This article is general information for educational purposes. Consult a qualified professional or review LinkedIn’s current terms of service and applicable US privacy regulations for guidance specific to your firm’s situation.